
In the second part of the International Energy Agency’s Net Zero 2050 Report summary, I focused on the alternative scenario envisioned by IEA to reach zero emissions by 2050, in a Q&A format in order to quickly grasp the important elements of IEA’s vision.
In the first part (here), I had summarized the first chapter of the report that clarifies the current situation and forecasts on the existing actions and pledges of the governments. Now the second part focuses on the second chapter of the report that provides a global path to achieve net-zero CO2 emissions in 2050. However, it is important to note that the authors of the report also state that this is not “the only” path to achieve this objective and there can be other paths as well.
Net Zero Emissions Scenario by IEA
What is the fossil-based energy suppy&demand forecast?
Net Zero Emissions (NZE) scenario bets a rapid drop in oil and natural gas demand as a result of collaborative actions of countries and industries. As a result, no fossil fuel exploration, no new coal mines or mine extensions, no new oil and natural gas fields are required except the ones that have already been approved for development.
What are the fossil-based price forecasts? What would be the implications?
Declining demand will result in lower fossil fuel prices. The barrel of oil price drops from 37 USD in 2020 to around 35 USD by 2030 and then further drops to 24 USD in 2050. Natural Gas is expected to stay around ~2 USD/MMBtu in the United States and ~4 USD in importing countries. Coal prices are expected to stay less than 50 USD/ton. Against the falling oil and gas demand, existing producers would opt to increase production while keeping prices low to increase their market share.
What are the policies to drift away from fossil-based fuels?
A rebound risk due to lower prices needs to be prevented by policies and regulations, in order to avoid any increase in unabated fossil fuel usage. Such policies include renewable fuel mandates, efficiency standards, market reforms, R&D, and the elimination of fossil fuel subsidies.
NZE Scenario considers gradually increasing carbon taxes: i.e. by 2030 ~130 USD/ton in advanced economies and ~15 USD/ton in developing economies; those increasing to ~250 USD/ton and 55 USD/ton by 2050 respectively.
What is the carbon budget?
Cumulative global energy‐related and industrial process CO2 emissions between 2020 and 2050 are stated as ~460 Gt in the NZE Scenario. Assuming parallel actions to address CO2 emissions from “agriculture, forestry, and other land use” (AFOLU), AFOLU emissions would be ~40 Gt CO2, reaching 500 Gt CO2 in total.
This figure is in line with the CO2 budgets included in the Special Report of Intergovernmental Panel on Climate Change (IPCC, the United Nations’ climate science research group), which indicated that “the total CO2 budget from 2020 consistent with providing a 50% chance of limiting warming to 1.5 °C is 500 Gt CO2”.
What will be the CO2 emissions?
It is expected that advanced economies would reach net-zero emissions by 2045 and would start to remove around 0.2 Gt CO2 by 2050, which is necessary to close the gap for developing economies.
CO2 emissions per capita in advanced economies would drop from around 8 tCO2 to ~3.5 tCO2 in 2030, which is equivalent to the current per capita CO2 emissions of the developing economies. By 2040, 0.5 tCO2 per person is expected to be reached by both economies.
Methane emissions from fossil fuel production and use will fall from the current 115 Mt (3.5 Gt CO2‐eq) to 30 Mt in 2030 and 10 Mt in 2050.
Emissions from electricity generation (largest emissions source in 2020), is expected to drop by 60% before 2030, then become net negative around 2040. By 2050, nearly 90% of all electricity generation will be from renewables. Also, hydrogen and hydrogen‐based fuels, bioenergy, and CCUS, especially in sectors where emissions are often most challenging to reduce will gain momentum after 2030.
How will be the Energy Supply balance?
TES is expected to decrease by 7% in 2030 thanks to an annual average 4% energy intensity reduction. This 4% prediction is rather aggressive compared to the <2% reduction achieved between 2010-2020.
Fossil-based energy share falls from 80% in 2020 to 20% in 2050, while the remaining is coupled with CCUS. Here, coal usage falls at an annual average of 7% until 2050. Oil demand falls by 20% in 2030 and almost by 75% in 2050 i.e. annual decline of more than 4%. Natural gas decreases by 5% in 2030 then reduced to 55% of 2020 in 2050 i.e. annual decline of ~3%. It is noted that fossil-based fuels will still be needed for chemicals production, or technology-mandatory sectors (eg. long-distance aviation); where the emissions are either abated with CCUS or offset by DAC and bio-energy CSS.
The low‐emissions liquid fuels use increase ~7 times in 2050, whereas the supply of low‐emissions gases increases by almost 9 times in 2030, then the increase reaches 25 times in 2050 compared to 2020. It implies that the increase in hydrogen production is twice faster than shale gas production increase in the US.
How will be the Energy Consumption?
Energy demand is expected to fall ~0.5% annually and reach 340EJ in 2050 thanks to efficiency improvements (otherwise would reach 640 EJ). Electricity consumption (incl. hydrogen production for energy) increases by 25% in 2030 and becomes 26% of total energy consumption. In 2050, electricity consumption is twice as high as 2020, therefore 50% of total energy consumption will be electricity, then 28% of the total energy consumption will come from the direct use of renewables and low‐emissions fuels; finally, the remaining ~20% will come from fossil-based fuels.
Until 2030, emission reductions are resulting from efficiency improvements, electrification of heat, and fuel switching to solar thermal, geothermal, and bioenergy. Thereafter, low-emission gases (i.e. mainly hydrogen) and CCUS take the lead in emission reductions, especially in steel, cement, high-temperature combustion, and chemicals production.
How will be the Energy Consumption particularly in Mobility?
Electricity becomes the dominant fuel in the transport sector accounting for 45% of the fuel energy consumption in 2050. Hydrogen and hydrogen‐based fuels account for 30% of the fuel consumption and bioenergy accounts for 15%.
Electricity will become the fuel of choice for 20% of road transportation in 2030 and 60% in 2050, while hydrogen and hydrogen‐based fuels will be used to fuel long‐haul heavy‐duty trucks. More than 60% of total passenger car sales globally are EVs by 2030, and the car fleet is almost fully electrified worldwide by 2050 (the remainder are hydrogen‐powered cars). For shipping, energy efficiency improvements will be backed-up with advanced biofuels and hydrogen‐based fuels (ammonia). In aviation, synthetic liquids and advanced biofuels grow rapidly, and their share rises from almost zero to 80% in 2050.
How will be the Energy Consumption particularly in Buildings?
The electrification of end‐uses including heating leads to an electricity demand increase by ~35% in 2050, accounting for ⅔ of total buildings sector energy consumption, while ¼ will come from Onsite renewables‐based energy systems such as solar water heaters and biomass boilers.
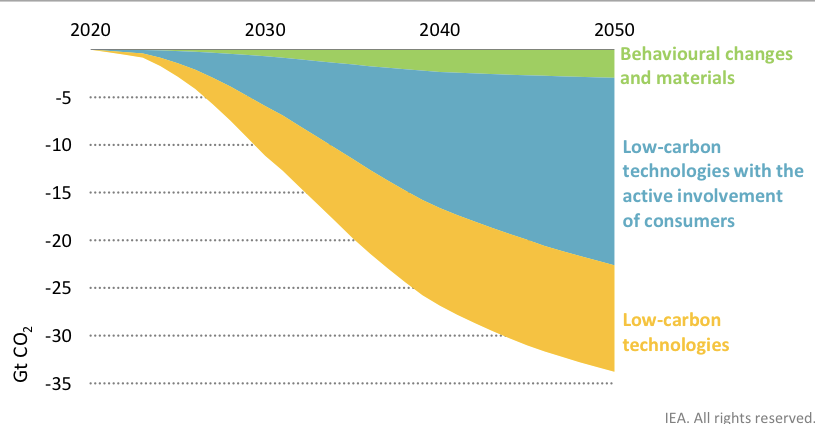
How will decarbonization occur?
The key pillars of decarbonization are energy efficiency, behavioral changes, electrification, renewables, hydrogen and hydrogen‐based fuels, bioenergy, and CCUS.
“40% of emissions reductions result from the adoption of low‐carbon technologies that require massive policy support and investment but little direct engagement from citizens or consumers, e.g. technologies in electricity generation or steel production. A further 55% of emissions reductions require a mixture of the deployment of low‐carbon technologies and the active involvement or engagement of citizens and consumers, e.g. installing a solar water heater or buying an EV. A final 8% of emissions reductions stem from behavioral changes and materials efficiency gains that reduce energy demand, e.g. flying less for business purposes“
IEA Net Zero by 2050 Report
What is the role of Energy Efficiency?
Energy efficiency is expected to play a dominant role in the first phase until 2030, with an annual average energy intensity improvement of around 4.2%, later reduced to ~2.7% after 2030. In overall energy efficiency os reducing the demand by 158 EJ in 2050,
What is the role of Behavioral Changes?
Behavioral changes reduce energy‐related activity by around 10‐15% on average over the period to 2050, reducing the demand by 37 EJ in 2050, a result avoiding 2.6 Gt CO2 emissions. Behavioral changes include reducing excessive energy consumption in buildings and roads, switching transport mode, and reducing materials consumption by recycling.
What is the role of Electrification?
The direct use of low‐emissions electricity replacing fossil fuels accounts for ~20% of emission reductions by 2050. The main reasons for the doubling electricity consumption between 2020 and 2050 are low and medium heat and the increase in secondary scrap-based steel production. This increase would need 3 times more annual electricity sector investment than seen in recent years.
What will be the impact of mobility decarbonization?
The battery demand for mobility increase 90 times, reaching 14 TWh in 2050. Such massive demand requires critical minerals for production. For example, lithium demand increases 30 times in 2030 and 100‐times in 2050 than in 2020. Yet, battery packs for mobility are expected to decrease from 130-155 USD/kWh levels in 2020 to 55-80 USD/kWh by 2050.
What is the role of Renewables?
The share of renewables in total electricity generation almost doubles to reach 60% in 2030 and reaches 90% in 2050. To achieve this, annual capacity additions of wind and solar between 2020 and 2050 are five times higher than the average over the last three years. Total annual PV capacity additions will reach 630 GW/year by 2030. In the end, renewable share in TFC will be 12% in 2030 and 19% in 2050.
What are the dispatchable renewables and their shares?
Dispatchable electricity means that its power output can be adjusted to balance out the grid demand. The main dispatchable renewables shares in total electricity generation in 2050 are hydropower with 12%, bioenergy with 5%, concentrating solar power with 2%, and geothermal with 1%.
What will be the role of Hydrogen?
Global hydrogen use expands to 200 Mt in 2030; the proportion of low‐carbon hydrogen rises from 10% in 2020 to 70%. 54% of this low-carbon hydrogen is produced via electrolysis, and the remaining half is produced from fossil-based fuels with CCUS.
By 2050, 30% of the low‐carbon hydrogen is in the form of hydrogen‐based fuels, which include ammonia and synthetic liquids and gases. Almost all hydrogen products are low carbon at that time and the electrolysis route reaches 62% of total production. Yet, such electrolysis capacity will require ~12,000 TWh, which is greater than the current total annual electricity demand of China and the United States combined. Such growth needs a rapid scaling up of electrolyzer manufacturing capacity and technologies for conversion to different hydrogen vectors for transportation.
Hydrogen can be used in different sectors, such as:
- Stored hydrogen can help balancing seasonal electricity demand fluctuations and intermittency of the off‐grid renewable systems
- Hydrogen can be blended with natural gas in gas networks to reduce emissions: eg. 15% volumetric blend in 2030 can reduce CO2 emissions from gas consumption by around 6%.
- Help decarbonization of fossil-based electricity production electricity through co-firing hydrogen in gas‐fired power plants or co-firing low-carbon ammonia in coal‐fired power plants; even if it represents only 2% of overall electricity generation capacity in 2050.
- Hydrogen provides ⅓ of fuel use in trucks in 2050 provided that the necessary infrastructure is built by 2030. Direct hydrogen use for mobility is expected to increase to 11 Mt in 2030 and to 106 Mt in 2050. By 2050, hydrogen‐based fuels also provide more than 60% of total fuel consumption in shipping. Cumulatively, Hydrogen usage in transportation is expected to increase first to 25 Mt in 2030, and then 207 Mt in 2050; which is almost half of the total hydrogen-based production growth.
What is the role of Bioenergy?
Today’s unsustainable, inefficient, and polluting solid biomass usage in traditional cooking methods ceased to exist by 2030 and to be replaced by modern bioenergy. By increasing around 3% annually, in 2050 bioenergy is expected to exceed 100 EJ and its share in TES would rise from ~7% today to ~14% in 2030, then ~18% in 2050. The biggest users will be for the paper sector and cement production: in 2050, bioenergy to provide 60% of energy demand in the paper sector and 30% of energy demand for cement production. One advantage of bioenergy is that it can be used as drop-in fuel in mobility and for natural gas blending, either without or with minor alterations. Another advantage is it can provide negative emissions to offset remaining hard-to-abate sectors; In 2050, around 10% of total bioenergy is used in facilities equipped with CCUS, and around 1.3 Gt CO2 is captured using BECCS.
What is the role of CCUS?
Carbon capture volumes are expected to be relatively flat during the next 5 years, then there will be a rapid expansion: 1.6 Gt CO2/year in 2030 and 7.6 Gt CO2/year in 2050. 50% of the avoided CO2 emissions in 2050 is from fossil fuel combustion, 20% is from industrial processes, and around 30% is from bioenergy use with CO2 capture (BECCS) and direct air capture (DAC). BECCS and DAC also result in negative emissions. While 95% of the total captured CO2 will be sequestrated, 5% will be used for synthetic fuel production.
CCUS is will be the main way to limit the process emissions that occur during cement manufacturing. CCUS is the key solution for the large numbers of coal power plants that have been built recently in emerging markets and developing economies. Also, CCUS provides low-cost dispatchable electricity via gas‐fired plants in the regions with cheap natural gas.
How much investment are we talking about?
Annual global investment in energy will first jump from 2 trillion USD to 5 trillion USD by 2030 and stabilize at 4.5 trillion USD by 2050. In terms of share of global GDP, it represents a jump from 2.5% to 4.5% in 2030 and stabilizing again at 2.5% by 2050. The biggest portion of this investment is due to electricity systems (i.e. electricity generation, storage and distribution, and public EV charging) and electrification investments (i.e. batteries for vehicles, heat pumps, and industrial equipment for electricity‐based material production). Hydrogen and CCUS will be other important investment items after 2030. Hydrogen investments (i.e. production facilities, refueling stations and end‐user equipment) exceed 470 bn USD/year in 2050) and CCUS investments exceed 160 bn USD/ year by 2050).
What are the key uncertainty areas?
IEA considers behavioral change, bioenergy, and CCUS to involve a high degree of uncertainty, each of these would raise investment to meet net-zero emissions by 4-15 trillion USD.
- If CCUS will not be utilized in fossil-fuel based investments, it will increase the risk of stranded assets and would require 15 trillion USD of additional renewable energy and hydrogen production investments to achieve the same level of emissions reductions in 2050. Besides, lack of CCUS development will hold back BECCS and DAC offsetting developments too.
- Lack of behaviour changes will result in additional emissions around 2.6 Gt CO2 in 2050. Avoiding these emissions through additional low‐carbon electricity and hydrogen would cost an additional USD 4 trillion.
- If bioenergy use would occur ~10% lower in 2050 (eg. a scenario when land use for bioenergy remains at the 2020 level), achieving net‐zero emissions would then require 4.5 trillion USD extra investment.
How is it possible to reach NZE in 2050 without CCUS?
In the case of a “Low CCUS” (LCC) scenario, in which no new fossil fuel CCUS projects are developed (except either approved or under construction ones), CO2 emissions captured from fossil fuels are only around 150 Mt in 2050 instead of 3.6 Gt.
First, in such a scenario, alternative technologies for some applications are not present (eg. electric cement kilns or electric crackers for chemicals production), which represents 1.2 Gt of additional CO2 emissions. If developed, those technologies would need additional 2,400 TWh electricity 45 Mt additional Hydrogen in 2050.
Secondly, 145 Mt of hydrogen that is produced in the NZE from fossil fuels equipped with CCUS needs to be produced via electricity, which would need additional 9,000 TWh electricity and 2,000GW electrolyzer capacity.
Thirdly, it would need 11,300 TWh additional electricity for industry and fuel transformation, and to replace electricity production from fossil-fuel powered plants equipped with CCUS in 2050. This equates to an additional 7,000 GW renewable capacity in 2050. Here, up to 90 bn USD in 2030 and up to USD 400 billion by 2050, of existing coal‐ and gas‐fired capacity could be stranded.
In the end, even if up to 650 bn USD investment in fossil fuel‐based CCUS would be avoided in the LCC, additional cumulative investment to reach net‐zero emissions in 2050 in the LCC is expected to be 15 trillion USD higher. Lacking industrial CCS development will also harm scaling DAC and BECSS technologies that are needed for offsetting the unavoidable CO2 emissions.
How technological developments can impact CO2 emissions reduction ambitions?
Besides significant uncertainty is associated with technology and innovation evolution, totaling up to 170 Gt CO2 emissions reduction, or close to half of the 2050 budget:
- ~50 Gt CO2 emissions reductions from the use of low‐emissions electricity are expected from the technologies that are currently at very low technical readiness level (TRL).
- Majority of the low‐carbon hydrogen value chain is not existing yet or at very low TRL eg. hydrogen‐based steel production. These accounts for ~24 Gt CO2 emissions reduction.
- More than half of the emissions reductions expected from CCUS are from unprecedented processes (eg. cement, steel, DAC, power generation). These accounts for ~58 Gt CO2 emissions reduction.
- 45% of emission reductions coming from sustainable bioenergy are expected from low TRL processes such as biomass gasification with Fischer-Tropsch synthesis. These accounts for ~37 Gt CO2 emissions reduction.